
Information Disclosure Based on the TCFD Recommendations
Information Disclosure Based on the TCFD Recommendations
June 24, 2025
Sun Frontier Fudousan Co., Ltd.
Sun Frontier Fudousan Co., Ltd. (“the Company”) established the “Sustainability Committee” on October 1, 2021, to more strongly promote activities that contribute to solving social issues and realizing a sustainable society, based on its corporate philosophy and mission. The Company has formulated a “Sustainability Vision” and defined specific measures and KPIs for each material to promote sustainability management.
Sustainability Vision
We will contribute to the realization of a sustainable society through our business activities while respecting the heart of altruism, the company policy.
Important Sustainability Issues (Materiality)
Important issues that we should address to realize our Sustainability Vision Environmental Protection, Regional Revitalization, and Human Resource Development
This document explains the Company’s sustainability activities related to climate change and the environment, in accordance with the “Information Disclosure Recommended by the TCFD.” The TCFD recommends that information be disclosed in line with the four disclosure elements of “governance,” “strategy,” “risk management,” and “metrics and targets,” to accurately understand how risk opportunities associated with climate change affect corporate management, including financial management. The Company will work to further expand information disclosure based on these four information disclosure areas recommended by the TCFD.
i. Governance
The Company recognizes addressing climate change and environmental issues as a critical management priority at our company. In coordination with Risk Verification Committee, Sustainability Committee compiles information on risk opportunities associated with climate change, examines response measures, and makes periodic reports to the Board of Directors. The Board of Directors oversees the progress of initiatives related to climate change issues discussed and reported by executive departments and formally includes these issues on the agenda at least once a year.
The President and CEO assumes ultimate responsibility for the assessment and management of risks, including those related to climate change, and receives reports on climate-related initiatives from the advisory bodies—Sustainability Committee and the Risk Verification Committee.
System of Sustainability Promotion

Meetings and Roles in the System of Sustainability Promotion
| Organizations and committees | Roles |
|---|---|
| Board of Directors | Receive reports from the Sustainability Committee on climate-related risk management and oversees progress of measures. |
| President & CEO | Receive reports on overall sustainability activities, including climate-related initiatives, from the advisory bodies—Sustainability Committee. Assumes ultimate responsibility for the assessment and management of risks. |
| Risk Verification Committee | As an advisory body to the President and CEO, it deliberates on comprehensive risk evaluation, including those related to climate change. It reviews risks reported by the Risk Management Committee and provides instructions to business divisions through the same committee. |
| Risk Management Committee | Deliberate on the comprehensive management of operational risks, including those related to climate change, and discusses appropriate response measures. The committee is convened monthly. |
| Sustainability Committee | As an advisory body to the President and CEO, it promotes sustainability activities, including climate change measures. In connection with the Risk Verification Committee and Risk Management Committee, compiling risk opportunities related to climate change from each department and group company, consider countermeasures, and regular reports to the Board of Directors. The committee is convened quarterly. |
ii. Strategy
Based on the TCFD recommendations, we analyzed scenario of risk opportunities related to climate change. Through the scenario analysis, we defined 1.5°C and 4°C scenarios based on scientific evidence from IEA (International Energy Agency) and assessed the importance of risk opportunities related to climate that might affect operations as of 2030.
Definition of Scenarios
| Scenario configuration | 1.5°C scenario | 4°C scenario |
|---|---|---|
| World view | The Japanese government will promote severe measures against climate change, including the introduction of a carbon tax, which will lead to drastic social changes, and regulations on plastic and climate change related information disclosure will be required. Damage from natural disasters such as flooding is limited |
There will be no climate action by the government beyond current measures and no climate change action is required. Abnormal weather such as droughts and floods due to rising temperatures will become apparent, sites will be damaged, and response costs and recovery costs at the time of the disaster are expected. |
| Reference scenario | IEA The Net-Zero Emissions by 2050 Scenario (NZE) / IEA World Energy Outlook 2021/ IEA World Energy Outlook 2018/ IPCC AR6 SSP1-1.9 | IEA World Energy Outlook 2021/ IEA World Energy Outlook 2018/ IPCC AR6 SSP5-8.5 |
| Characteristics | Transition risks related to policies, etc. are likely to become apparent. | Physical risks associated with abnormal weather, etc. are likely to become apparent. |
Identification and assessment of risk opportunities
We assessed the impact of climate-related transition and physical risks across all of our group’s businesses, including Real Estate Revitalization, Real Estate Services, Hotel and Tourism, and Other Businesses (Overseas Development and Construction). For transition risks, we considered a wide range of factors including policy and regulatory changes, as well as market shifts. For physical risks, we examined both acute and chronic risks. We will take action on those risk opportunities that are assessed to have a particularly significant impact on our business.
Scope:
Real Estate Revitalization Business, Real Estate Service Business, Hotel and Tourism Business, Other Business (Overseas Development Business and Construction Business)
Impact:
- High: Very significant impact (> 19% of net sales)
- Medium: Significant (10-19% of net sales)
- Small: Limited impact (<10% of net sales)
Term of risk occurrence:
- Short term: Within one year
- Medium term: Within 1 to 5 years
- Medium to long term: Within 5 to 10 years
- Long term: Over 10 years
List of risk opportunities
The list includes the risk opportunities recognized by the Company whose impact on the business is “medium” or above.
| Main category | Sub-category | Details of risk opportunities | Impact on business and financial results | Timing of risk opportunities | |
|---|---|---|---|---|---|
| 1.5℃ | 4℃ | ||||
| Company-wide | |||||
| Transition risk | Reputation | Stakeholder Concerns about Passive ESG Responses | Medium | - | Medium to long term |
| Real Estate Revitalization Business | |||||
| Transition risk | Policy regulation | Additional capital investment costs due to increased energy efficiency standards to be met in repairs | Medium | - | Short term |
| Physical risk | Chronic | Increase in cost of air conditioning equipment and increase in energy cost at owned properties | Small | Medium | Medium term |
| Opportunity | Products and Services | Increase in selling prices to property owners and building owners by improving the environmental performance of properties in replanning | Medium | Medium | Short term |
| Hotel and Tourism Business | |||||
| Transition risk | Policy regulation | There is a growing trend toward constructing buildings with high environmental performance, leading to shortages of environmentally friendly materials and rising labor costs due to the concentration of construction projects | Medium | - | Medium term |
| Opportunity | Products and Services | Contribute to the local community by conserving and coexisting with nature in the area where the hotel is located, thereby improving the image of the hotel and increasing the number of guests | Medium | Medium | Medium term |
Financial impact
The list includes the results of calculating the financial impact of the risk opportunities recognized by the Company.
| Risk / Opportunity | Business impact | Calculation method (*1) | Financial impact 2030 (billion yen) |
Degree of influence | |
|---|---|---|---|---|---|
| 1.5℃ | 4℃ | ||||
| Carbon tax | Increased tax burden due to large increase in carbon tax | [Company-wide] Company's CO2 emissions carbon price per unit of emissions |
3.23 | - | Small |
| Carbon tax | Large increase in carbon tax leading to higher costs for raw materials with large unit emissions | [Real Estate Revitalization] Input cost of raw materials (*2) emission intensity of raw materials carbon price per emission |
1.93 | - | Small |
| Sales losses due to natural disasters | Sales loss due to interruption of business activities because of damage to a business site caused by a natural disaster | [Real Estate Revitalization] (Not calculated as the impact on rent income is difficult to calculate) |
- | - | - |
| [Hotel Management] Daily sales loss maximum days of downtime (*3) damage ratio (*3) |
1.97 Probability of occurrence: 1.4% |
1.97 Probability of occurrence: 2.8% |
Small | ||
| Flood damage due to sea level rise | Occurrence of flood damage to owned real estate due to high tides and heavy rains caused by rising sea levels | [Real Estate Revitalization] (Not calculated because the properties owned are located in Tokyo and the impact of storm surge is minimal.) |
- | - | - |
| [Hotel Management] Repair cost by flood depth level due to sea level rise × amount of real estate owned (*4) |
0.62 Probability of occurrence: 1.4% |
0.62 Probability of occurrence: 2.8% |
Small | ||
| Improvement of selling prices of properties | Improving the selling price to the wealthy and building owners by improving the environmental performance of the property | [Real Estate Revitalization] Total floor area of BELS certified properties (*5) difference in rent between BELS certified and ordinary properties (*6) |
0.81 | 0.81 | Small |
| Employee Health | Increase in cost due to heat allowance from rising temperatures | [Property Management / Building Maintenance] Heat allowance Number of extremely hot days |
0.002 | 0.003 | Small |
| Business Continuity | Profit loss due to operational shutdown | [Property Management / Building Maintenance] Daily profit loss Maximum number of shutdown days Damage ratio |
0.0003 | 0.001 | Small |
| Increased Demand Opportunity | Revenue increase from expanded maintenance demand | [Property Management / Building Maintenance] Maintenance service revenue (1 + Probability of flood occurrence) |
6.47 | 6.56 | Small |
| Business Continuity | Profit loss due to operational shutdown | [Rent Conference Room] Daily profit loss Maximum number of shutdown days × Damage ratio |
0.0002 | 0.0004 | Small |
| Employee Health | Increase in cost due to heat allowance from rising temperatures | [Construction] Heat allowance Number of extremely hot days |
0.0004 | 0.001 | Small |
| Additional Labor Cost | Additional personnel cost due to reduced work efficiency from rising temperatures | [Construction] Additional number of workers due to reduced efficiency Labor cost per person |
0.01 | 0.002 | Small |
| Carbon Tax | Cost increase due to carbon pricing | [Overseas Development] Scope 1 & 2 emissions Carbon price |
0.0001 | - | Small |
- *1 Base year is Fiscal 2022. / The impact in 2030 is calculated by reflecting the CAGR (Compound Annual Growth Rate)
- *2 For cement and ready-mixed concrete with high emission intensity, the amount of input is calculated from the total floor area of properties sold in the base year using an LCA tool
- *3 Determined by investigating the flood depth level at the time of the occurrence of a storm surge at the hotel
- *4 Determined by investigating the flood depth level at the time of the occurrence of a storm surge at the hotel (owned property).
- *5 Total floor area of BELS certified properties in the base year
- *6 Difference in unit price per tsubo between the BELS certified property in the base year and the Company's RP property in the vicinity as of March 31, 2024
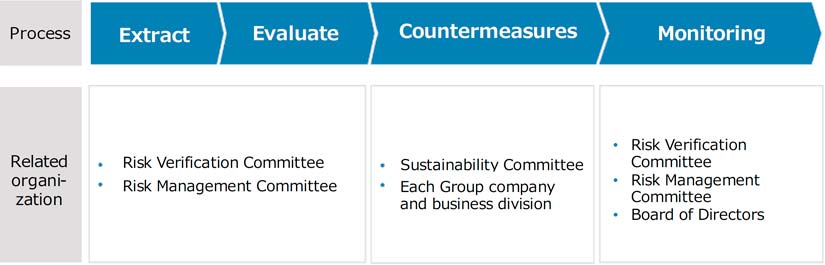
iii. Risk management
To establish a sustainability framework, the Company has set company-wide risk management regulations and established the Sustainability Committee to address overall sustainability issues, including those related to climate change. With regard to climate-related risks, the Risk Verification Committee evaluates risks reported by the Risk Management Committee. The Sustainability Committee then deliberates on appropriate countermeasures. Following this, each business department and group company implements risk responses accordingly. In addition, the Board of Directors receives reports from the Risk Management Committee on the status and response measures concerning comprehensive risk management, including climate-related risks.
iv. Metrics and Targets
The Company calculates greenhouse gas emissions as an indicator for evaluating climate-related risk opportunities. In Fiscal years 2022, we calculated "fuel use (CO₂)" for Scope 1, "electricity supplied by others (CO₂)" for Scope 2, and "other indirect emissions (CO₂)" for Scope 3. We will continue to monitor our greenhouse gas emissions, expand the scope, and aim for reductions, while building systems and setting targets.
Greenhouse Gas Emissions
(Consolidated)
| Fiscal 2021 annual emissions (t-CO₂e) |
Fiscal 2022 annual emissions (t-CO₂e) |
Fiscal 2023 annual emissions (t-CO₂e) |
Fiscal 2024 annual emissions (t-CO₂e) |
|
|---|---|---|---|---|
| Scope1 *1 | 4,088.5 | 3,237.9 | 3,391.9 | 3,645.7 |
| Scope2 *2 | 6,692.5 | 7,633.7 | 7,281.2 | 7,693.1 |
| Scope3 *3 | 194,929.0 | 152,744.0 | 148,333.7 | 336,043.2 |
(Non-consolidated)
| Fiscal 2021 annual emissions (t-CO₂e) |
Fiscal 2022 annual emissions (t-CO₂e) |
Fiscal 2023 annual emissions (t-CO₂e) |
Fiscal 2024 annual emissions (t-CO₂e) |
|
|---|---|---|---|---|
| Scope1 *1 | 0.0 | 0.0 | 0.0 | 0.0 |
| Scope2 *2 | 196.3 | 195.1 | 88.0 | 121.0 |
| Scope3 *3 | 194,929.0 | 152,744.0 | 148.333.7 | 274,961.7 |
- *1 Emissions from gas and gasoline use
- *2 Emissions from electricity use
- *3 Other indirect emissions
-
- Calculation period: Fiscal 2021 (April 2021 to March 2022), Fiscal 2022 (April 2022 to March 2023), Fiscal 2023 (April 2023 to March 2024) and Fiscal2024 (April 2024 to March 2025)
- To be disclosed: domestic and international consolidated subsidiaries (Scope1 and 2), Real Estate Revitalization Business (Scope3)
- Calculation method: market-based
- Calculation methods are based on location (calculated using the average emission intensity for Japan as a whole) and market (calculated using the emission intensity of each electric power company). We adopted the latter market-based method.
- Scope 2 Emission Factors Used: Emission factors by electric utility provider based on actual results for Fiscal2020, Fiscal2021, Fiscal2022, and Fiscal2023.
- From Fiscal2024 onward, the Scope 3 boundary has been expanded to cover the entire consolidated group.
(Fiscal2021 to Fiscal2023 calculations covered only our replanning business.)
For the calculation of Category 1, the recycled content method (cut-off approach) has been adopted.
Target of Greenhouse gas emissions reduction (compared to Fiscal 2022)
| 2030 | 2050 | Fiscal 2024 Results |
|
|---|---|---|---|
| Total of Scope 1 and Scope 2 |
22% reduction (annual reduction of 2.7%) |
Carbon neutral | 11.7% increase |